Liikkumispalveluiden käyttö ikäryhmittäin
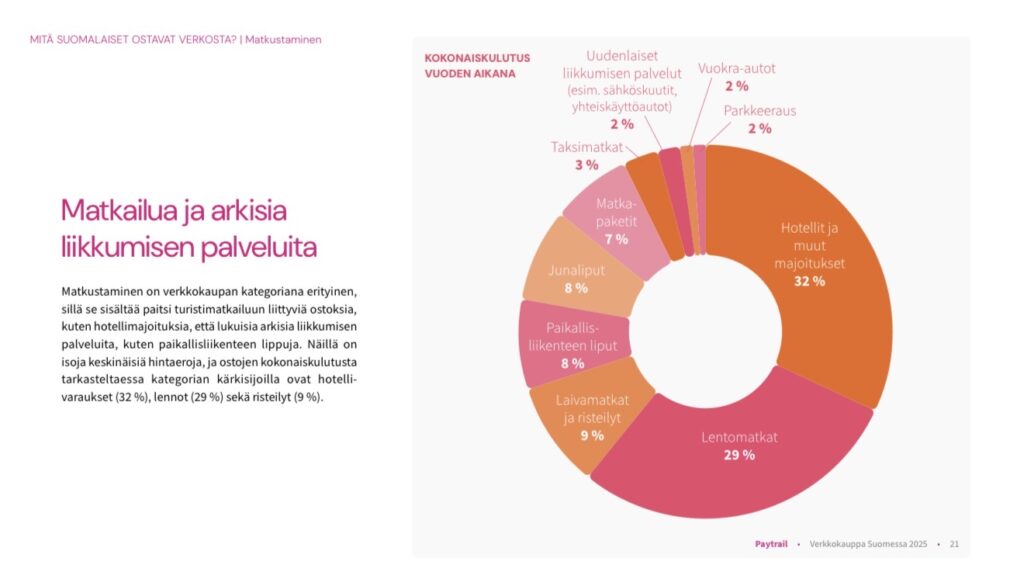
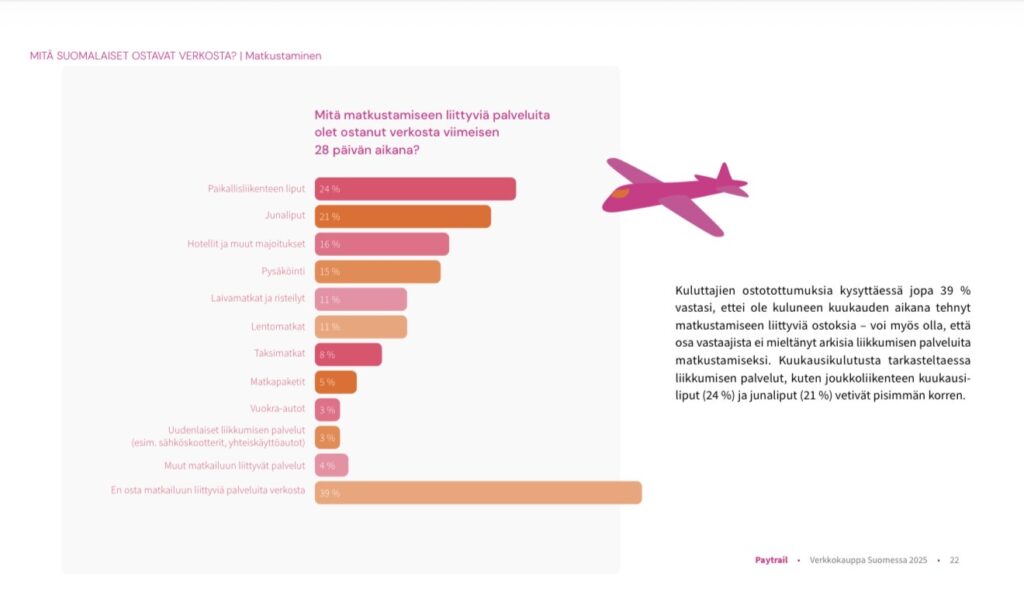
🇫🇮 Matkailu digitalisoitui nopeasti 2010-luvulla Hotellit ja majoitukset – 32 % Lennot – 29 % Risteilyt/laivamatkat – 9 % Junaliput – 8 % Paikallislikenteen liput – 8 % Matkapaketit – 7 % 39 % ei ostanut mitaan matkustamiseen liittyvaa viimeisen 28 paivan aikana Yli 50-vuotiaista 54 % ei ostanut lainkaan
Osuus on pienentynyt, mutta laajentunut uusiin palveluihin (esim. sahkoskuutit) Taksimatkat – 3 %
Vuokra-autot – 2 % Pysakointi – 2 % Uudet liikkumispalvelut – 2 % Nuorin ikaryhma osti enitan lento- ja junalippuja 30-49 vuotiaista 19 % osti hotellimajoituksen 18-29-vuotiaista 6 % maksoi vuokrattavista llikumispalveluista, yli 50-vuotiaista 0 %
Uudet liikkumispalvelut yleistyvät
Nuoret käyttävät vuokrattavia liikkumispalveluita muita ikäryhmiä useammin.
Use of Mobility Services by Age Group
🇬🇧Travel digitalized quickly in the 2010s Hotels & accommodation – 32 % Flights – 29% Cruises/ferries – 9 % Train tickets – 8 % Local transit tickets – 8 % Travel packages – 7 % Its share has shrunk but expanded into new services ( e.g. e-scooter rentals) Taxi rides – 3 % Rental cars – 2 % New mobility services – 2 % Parking – 2 % 39 % bought nothing travel- related in the last 28 days Youngest age group bought the most flight & train tickets 19 % of 30-49- years- old bought a hotel stay 6 % of 18-29 years- old paid for rental mobility vs. 0 % of over- 50s 54% of over- 50s
54% of over- 50s bought nothing in this category at all New Mobility Services Are Gaining Ground
Younger people use rental mobility services more often than older age groups